 Florian S.
 Luca Dalla C.
What are Candlestick Patterns?
In the world of cryptocurrency trading, the importance of candlestick charts cannot be overstated. They are not just lines and shapes; they are the heartbeat of the market. In this blog post, we will talk about the technical aspects of candlestick charts and why understanding them is crucial for any crypto trader.
The Language of Candlestick Charts
Candlestick charts are the preferred language of crypto traders. Just like learning a foreign language opens up new worlds of communication, understanding candlestick charts allows you to communicate with the market. It’s like having a conversation with the crypto world, where each candlestick speaks volumes about price movements.
Interpreting Candlestick Patterns
Candlestick patterns are not random; they follow specific rules and principles. They reveal the flux and flow of market sentiment. For instance, a “Doji” candle signals indecision in the market, while a “Bullish Engulfing” pattern suggests a potential upward trend. By mastering these patterns, you can anticipate market behavior, much like a skilled chess player anticipates their opponent’s moves.
Identifying Trends
Candlestick charts provide a visual representation of market trends. Imagine you’re hiking in the mountains, and you see a trail of footprints in the snow. Those footprints tell the story of someone who came before you. Similarly, candlestick patterns leave a trail of clues about where the market has been and where it might be heading. Recognizing trends is essential for making informed trading decisions.
Risk Management
Understanding candlestick charts isn’t just about predicting price movements; it’s also about managing risk. Think of it as driving a car at night with headlights. Candlestick patterns illuminate the path ahead, helping you avoid potential pitfalls. They can signal when a trend is losing steam, allowing you to exit a trade before it turns against you.
Entry and Exit Points
Candlestick are also your GPS in the crypto market. They guide you to entry and exit points. For instance, a “Hammer” candlestick at the bottom of a downtrend may signal a reversal, indicating a good entry point. Conversely, a “Shooting Star” at the top of an uptrend might suggest it’s time to exit. These technical details are the building blocks of a successful trading strategy.
Risk vs. Reward
Every trade involves a balance between risk and reward. Candlestick charts help you assess this balance with precision. They provide information about potential profit targets and stop-loss levels. It’s like having a financial compass that keeps you on course and ensures you don’t sail into dangerous waters.
The basics of candlestick Charts
The Basics of Candlestick Charts. Explanation of candlestick chart components. Candlestick body. Wick or shadow. How to read candlestick charts. Bullish vs. bearish candles. Candlestick colors and meanings. Timeframes and their impact on candlestick patterns.
So, candlesticks are great, but what exactly makes a candlestick?
Components of Candlestick Charts:
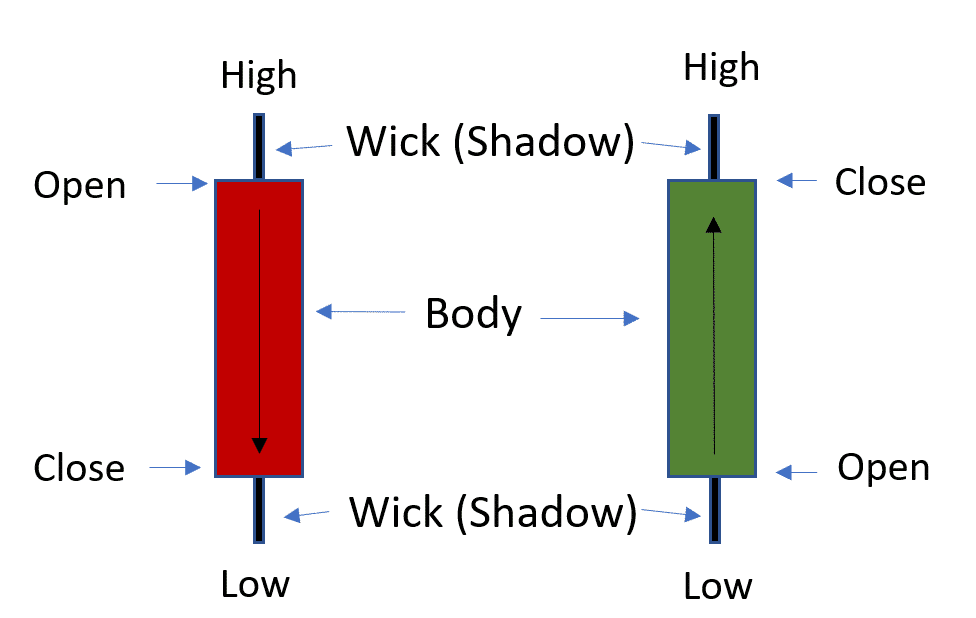
Candlestick Body:
- At the core of a candlestick lies its body, which is shown as a rectangular shape. The body spans the opening and closing prices for a specific time interval. A filled (or solid) body signifies that the closing price was lower than the opening price, denoting bearish sentiment, while an unfilled (or hollow) body represents the converse - a higher closing price than opening, indicating bullish sentiment.
Wick or Shadow:
- Extending from the body are thin lines, referred to as wicks or shadows. These lines represent the highest and lowest prices reached during the same time interval. The upper shadow emerges from the top of the body and denotes the high price, while the lower shadow emerges from the bottom and signifies the low price.
How to Read Candlestick Charts
Reading candlestick charts means understanding the dynamics between the bodies, shadows, and their respective positions. The length of the body provides insights into the magnitude of price change during the specified time frame. A long body indicates substantial price movement, while a short body suggests limited price fluctuation.
The relationship between the body and its surrounding shadows is equally critical. If a candle exhibits a small body with long shadows, it may indicate indecision or a struggle between buyers and sellers. Conversely, a candle with a small body and short shadows often signifies strong consensus among market participants.
Bullish vs. Bearish Candles
Candles can be categorized into two primary types: bullish and bearish. A bullish candle, often depicted with an unfilled body, signifies that the closing price exceeded the opening price. This suggests optimism and buying pressure, with a belief that prices will rise further. On the contrary, a bearish candle, characterized by a filled body, indicates pessimism and selling pressure, predicting a potential decline in prices.
Candlestick Colors and Meanings
The coloring of candlestick bodies plays a role in conveying sentiment. In many charting systems, bullish candles are typically green or white, while bearish ones are red or black. This color scheme serves as a visual cue, making it easier for traders to discern market sentiment at a glance.
Timeframes and Their Impact on Candlestick Patterns
The timeframe chosen for candlestick analysis influences pattern recognition, a LOT. Shorter timeframes, such as one-minute or five-minute charts, show rapid price fluctuations and are conducive to identifying micro-trends and scalping strategies. Conversely, longer timeframes, such as daily or weekly charts, provide a broader perspective, revealing macroeconomic trends and facilitating long-term investment decisions.
The impact of candlestick patterns always has dissenting opinions regarding their efficacy, their popularity and continued use among traders underscore their enduring significance in market analysis.
Common Candlesticks Patterns
Let’s see which are the common candlestick patterns, and let’s categorizing them into three broad groups: Bullish, Bearish, and Neutral.
Bullish Patterns:
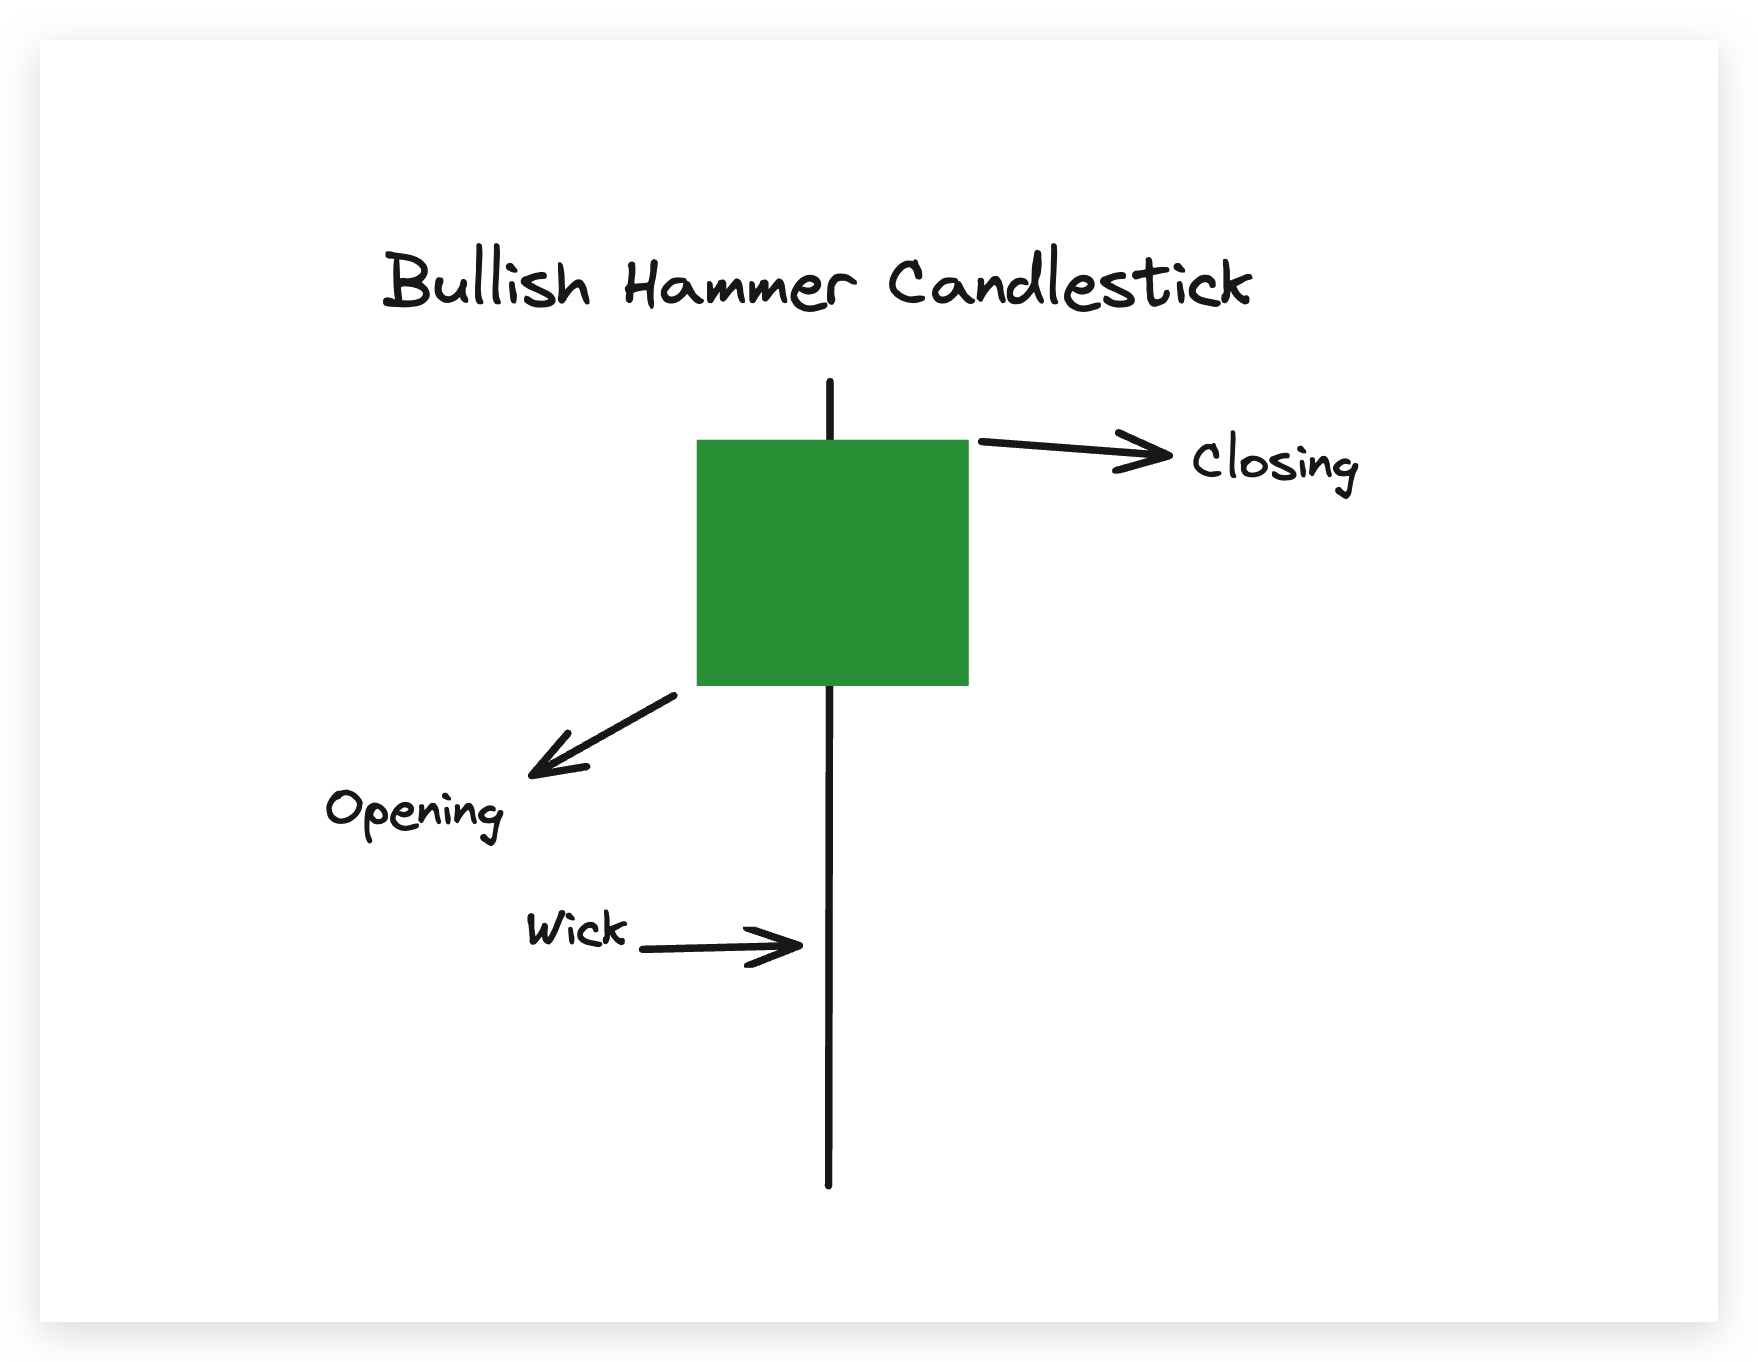
Hammer:
The Hammer, characterized by a small real body near the bottom of the candlestick, possesses a long lower shadow and little to no upper shadow. This pattern suggests a potential reversal of a downtrend. The long lower shadow indicates that sellers tried to drive the price down, but the buyers emerged victorious, pushing the price higher, thus signifying a shift in market sentiment from bearish to bullish.
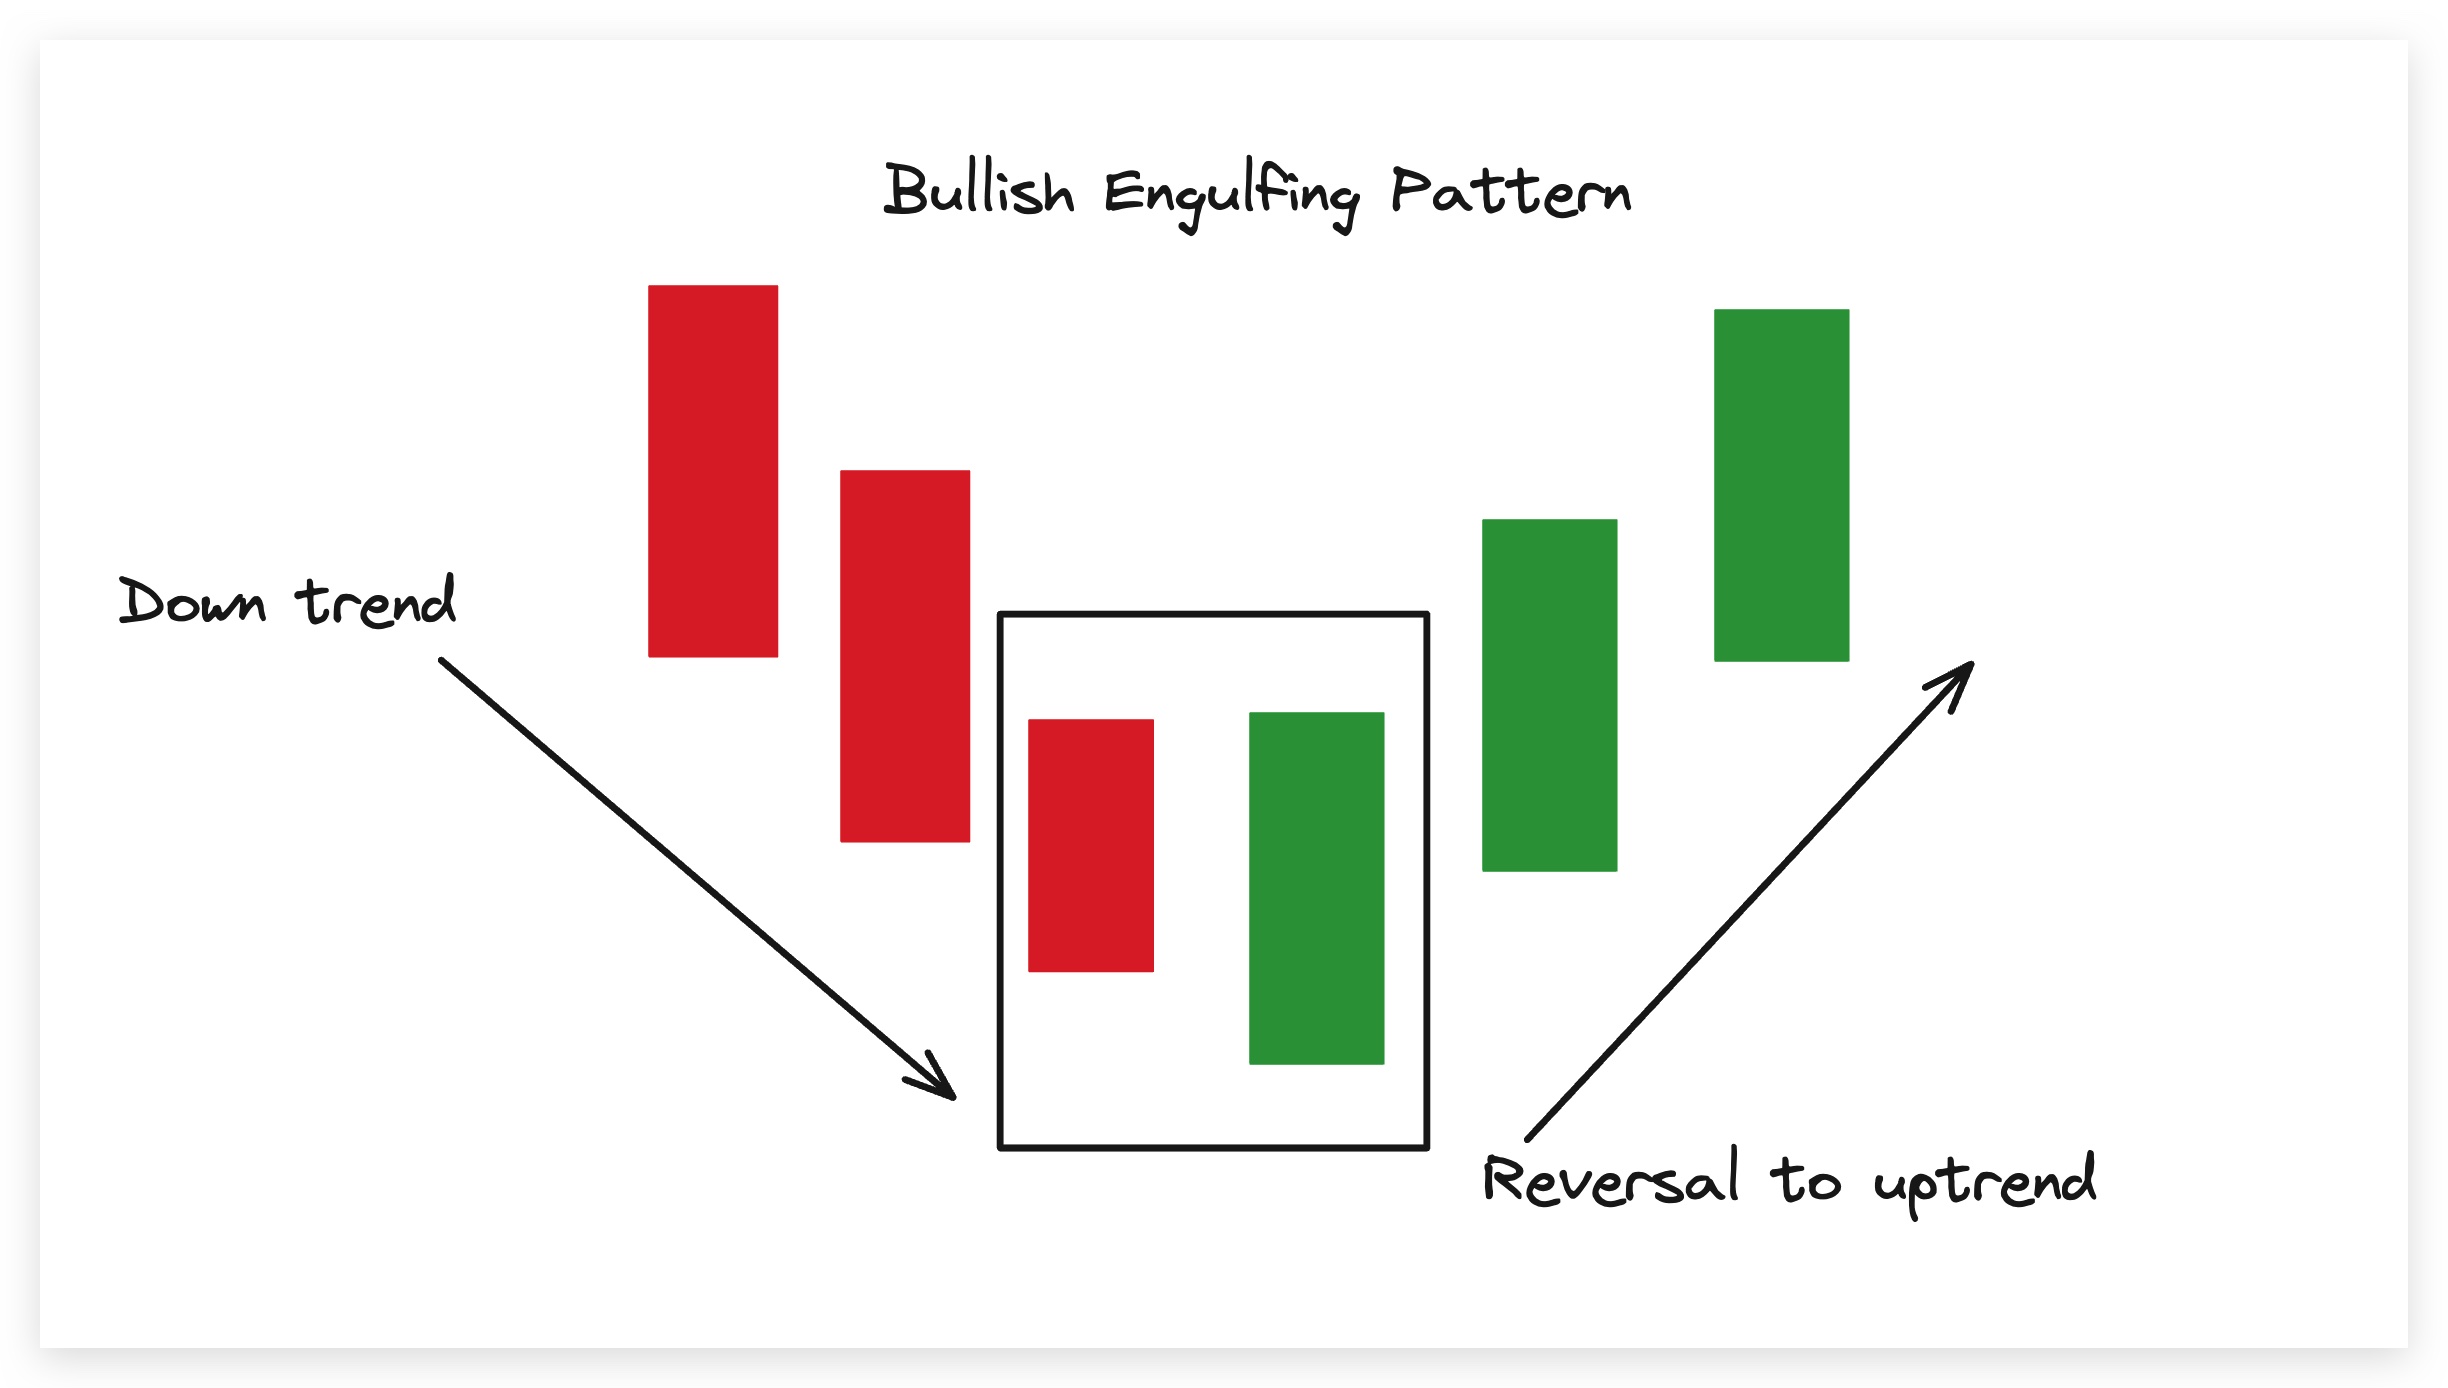
Bullish Engulfing:
The Bullish Engulfing pattern consists of two candlesticks: the first is smaller and bearish, followed by a larger bullish candlestick that engulfs the previous one. This pattern signifies a reversal from a bearish to a bullish trend, demonstrating that buyers have seized control after a period of seller dominance.
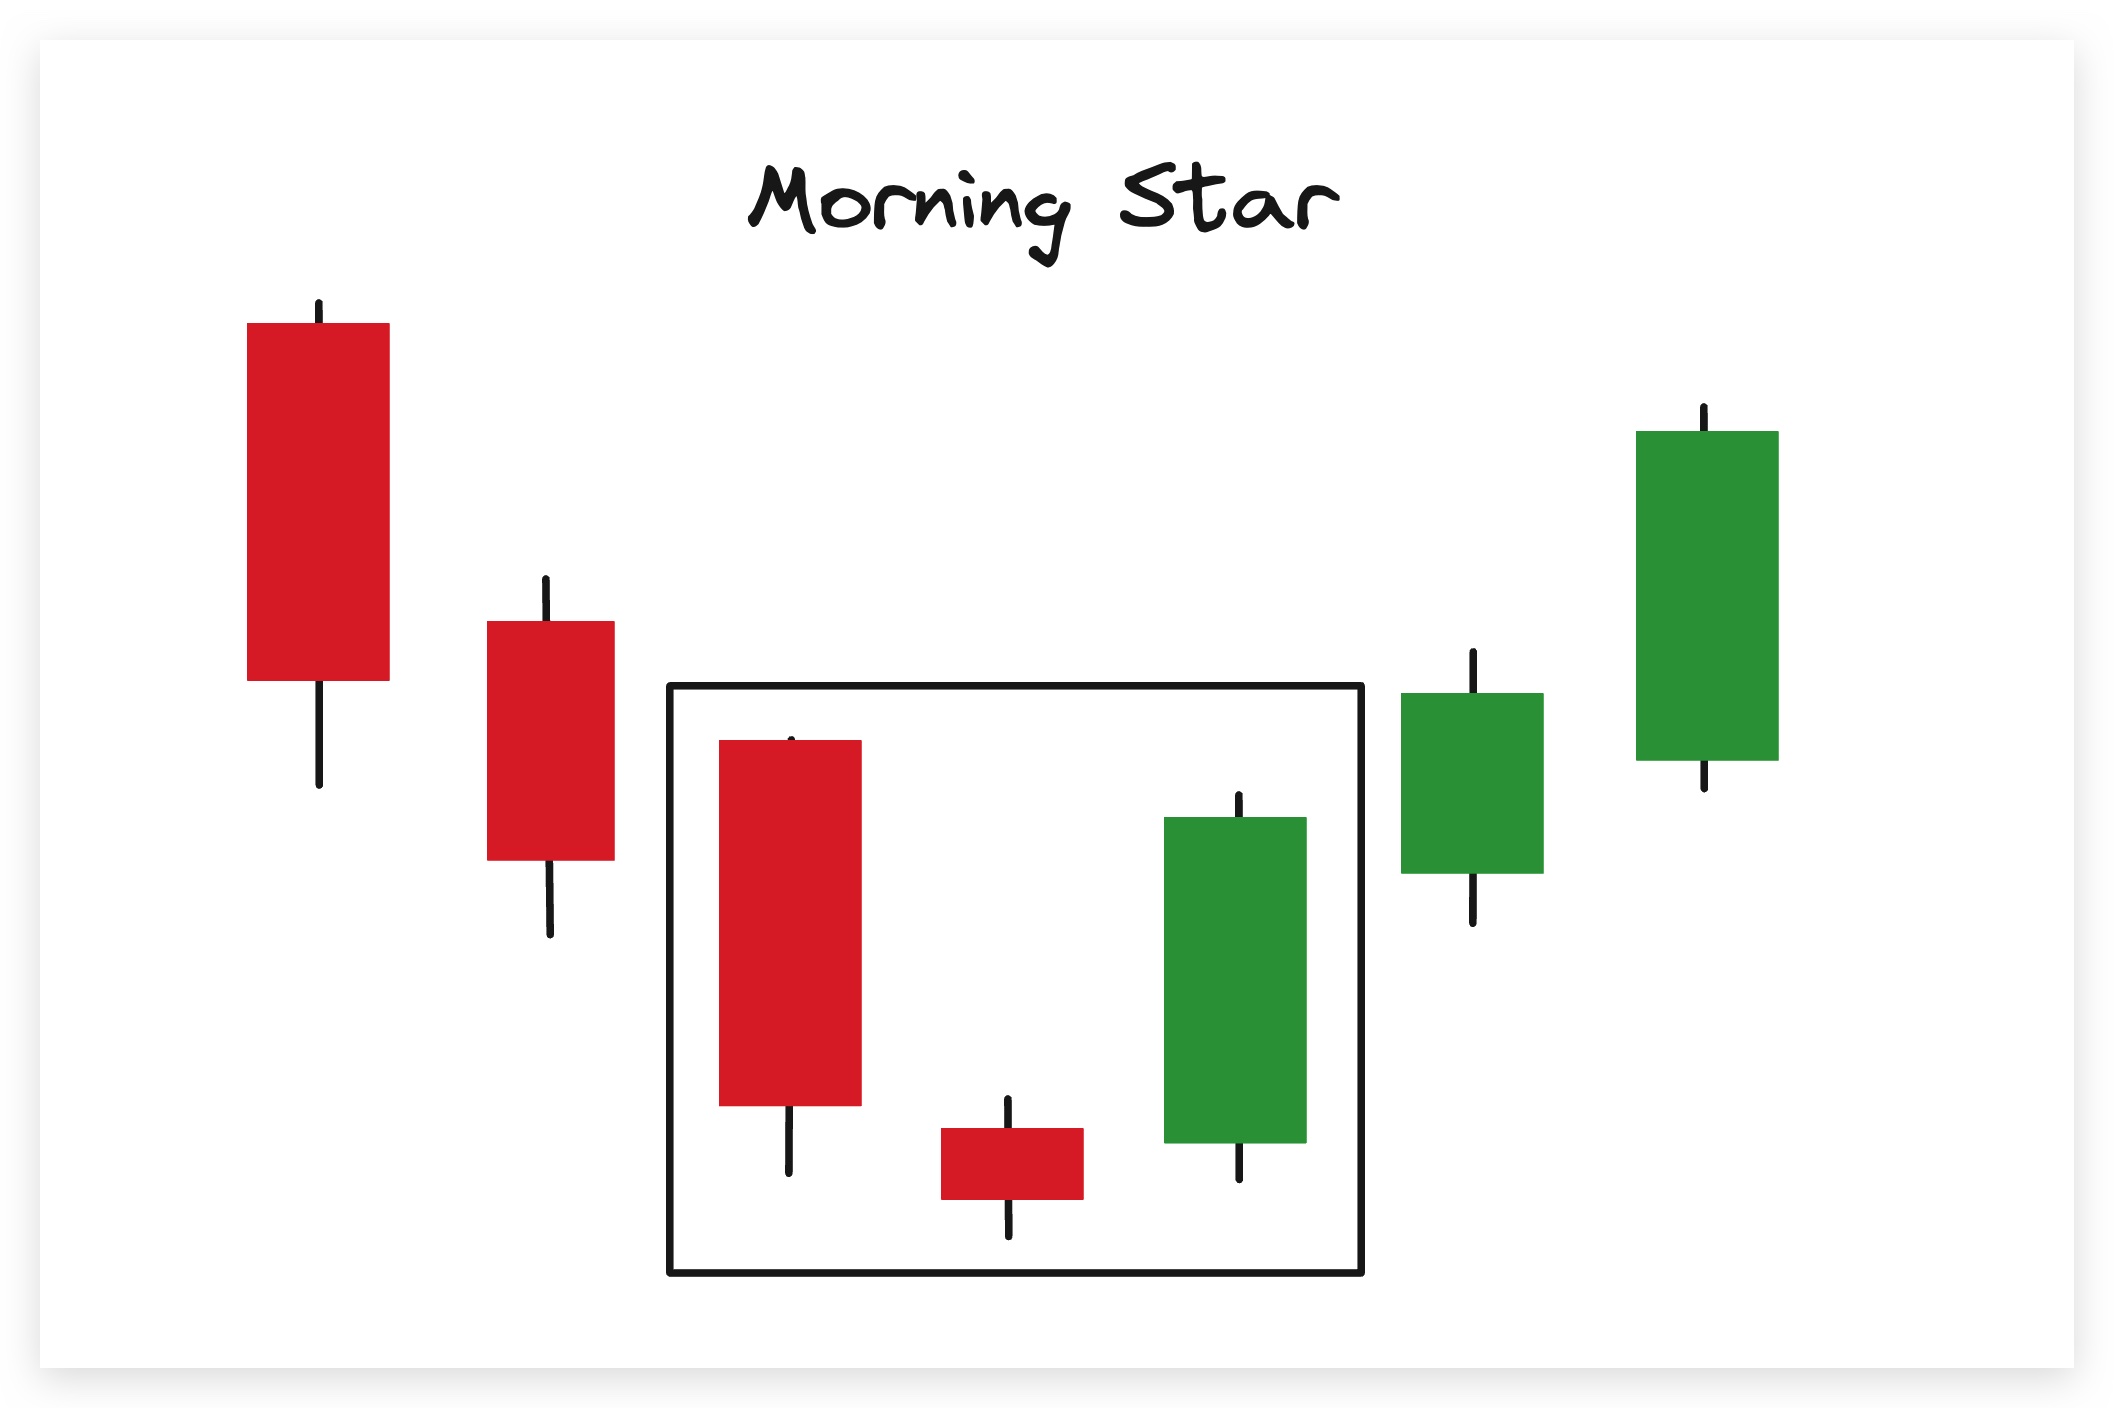
Morning Star:
The Morning Star pattern comprises three candlesticks. It begins with a bearish candlestick, followed by a smaller doji or spinning top, and concludes with a bullish candlestick that closes above the first candle’s midpoint. This pattern suggests a bullish reversal and indicates a transition from bearish sentiment to bullish conviction.
Bearish Patterns:
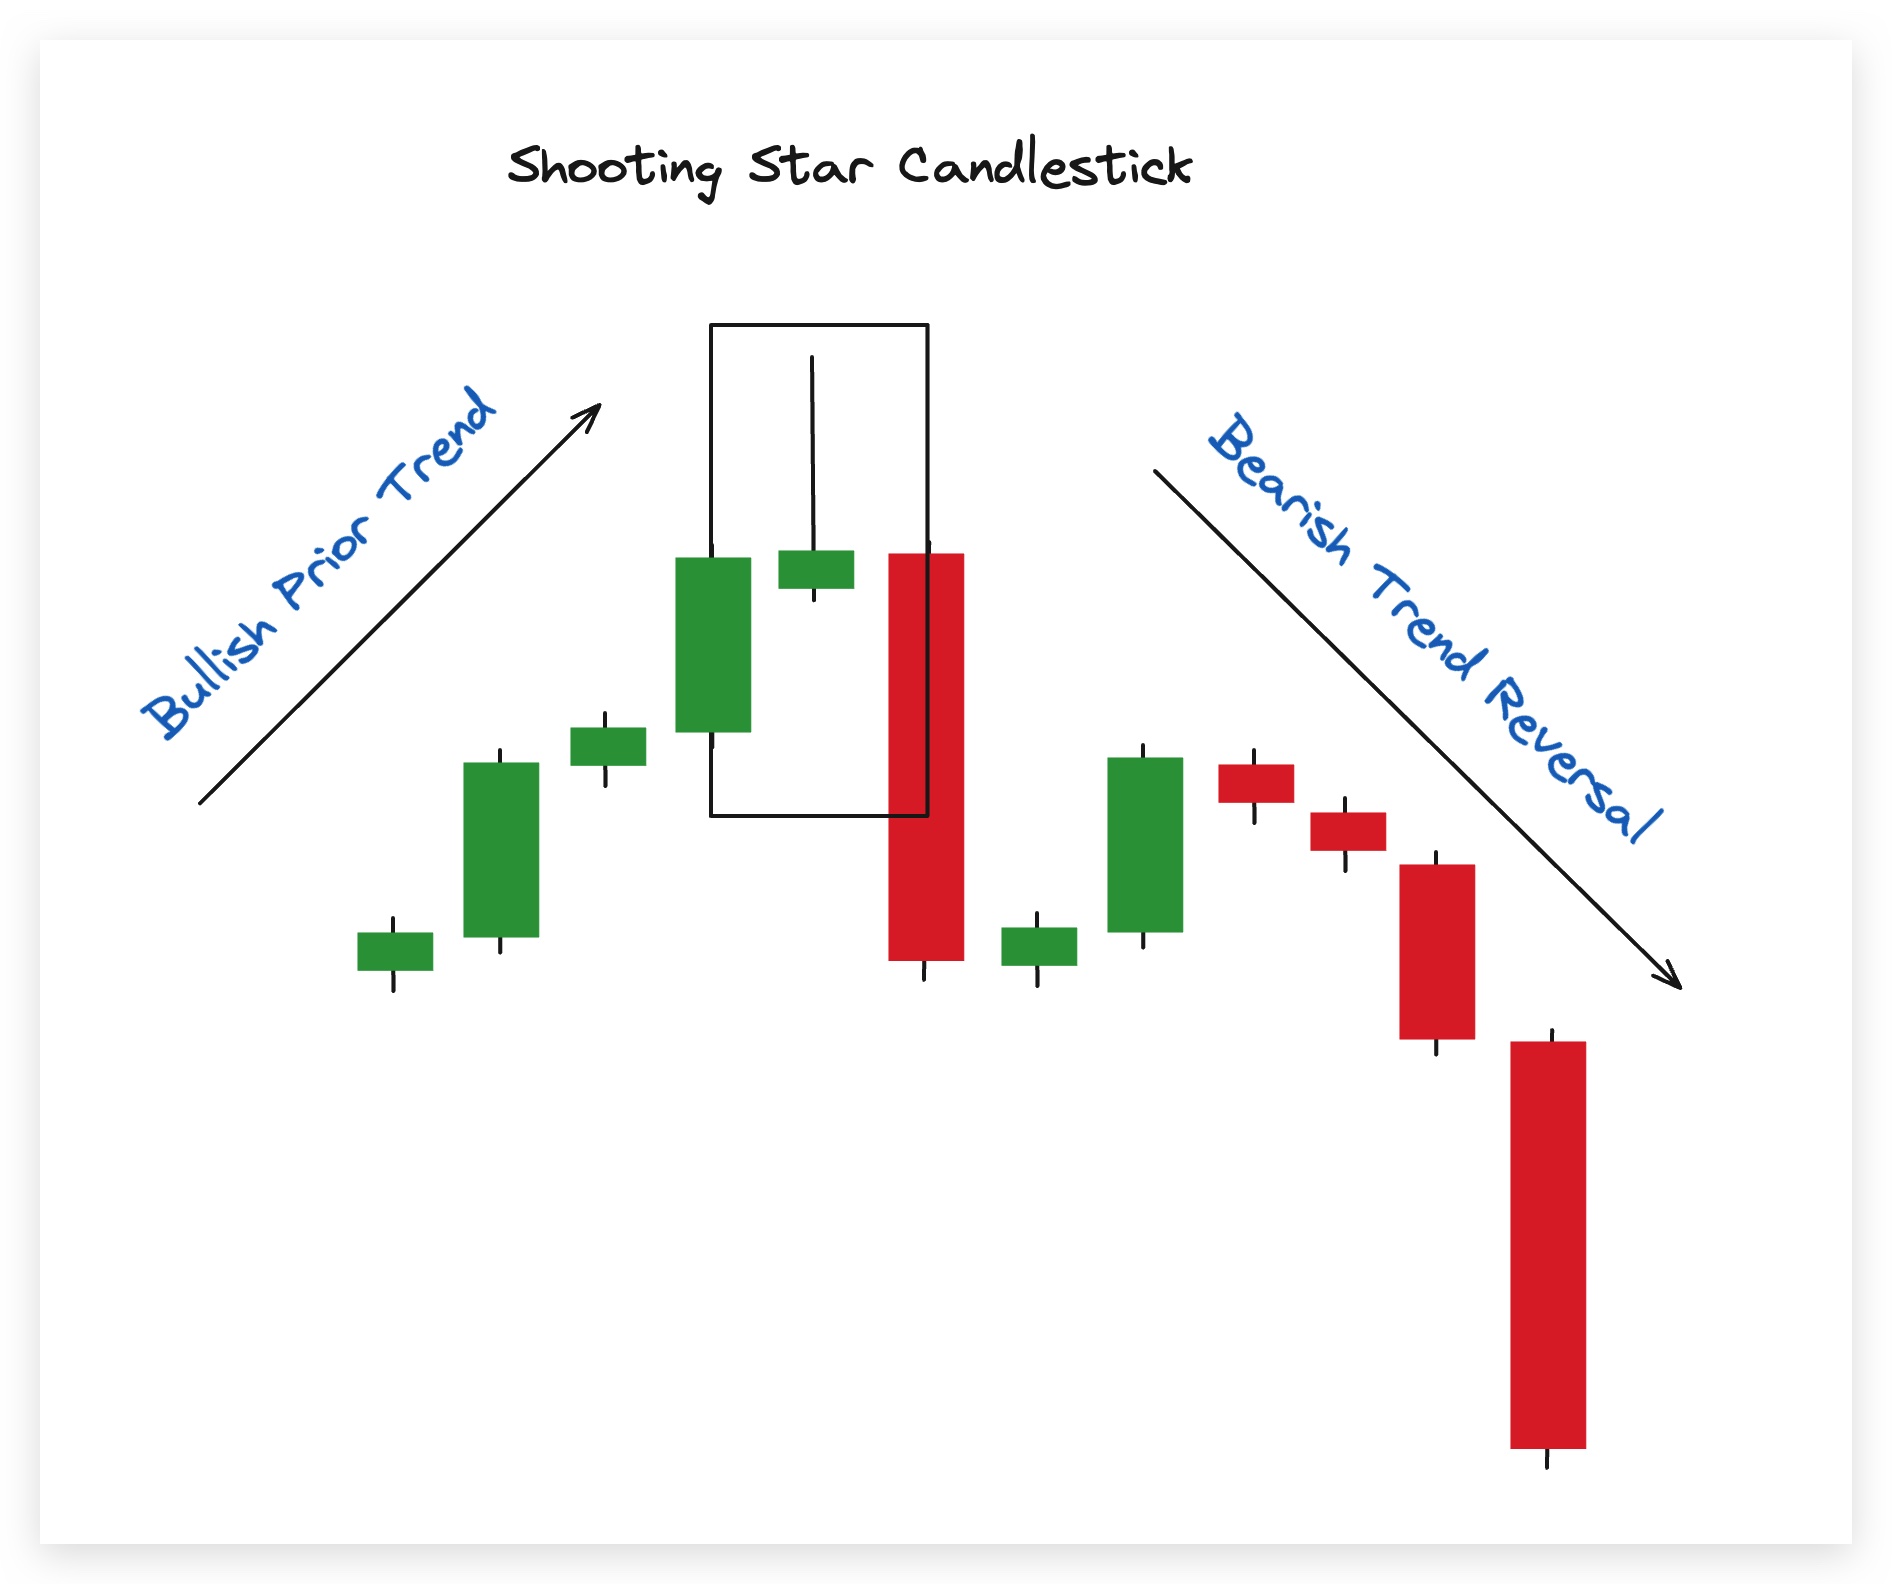
Shooting Star:
The Shooting Star pattern is the inverse of the Hammer. It features a small real body near the top of the candlestick, with a long upper shadow and little to no lower shadow. This pattern suggests a potential reversal from a bullish to a bearish trend, as sellers have momentarily overwhelmed the buyers, causing a shift in market sentiment.
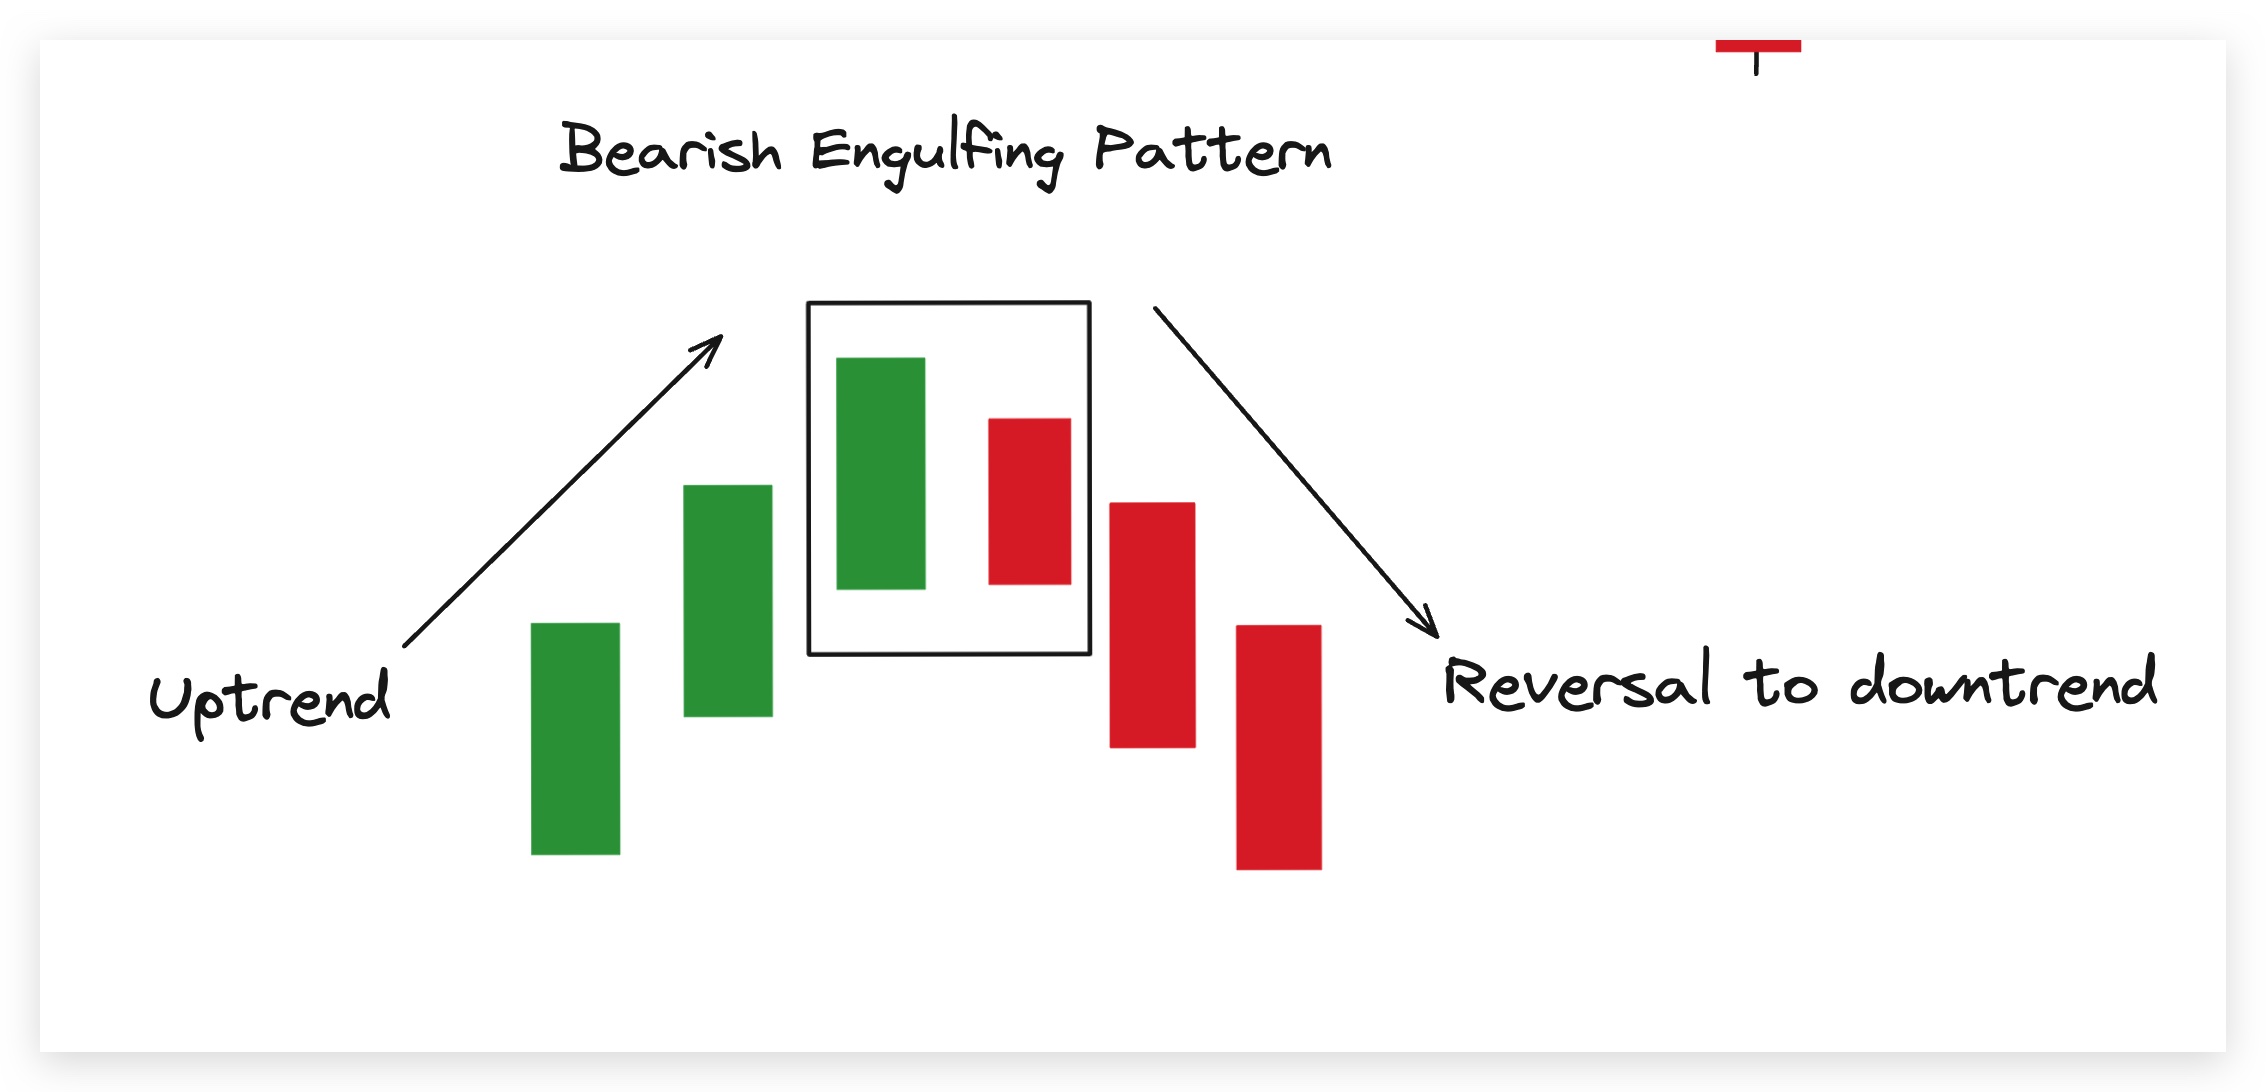
Bearish Engulfing:
The Bearish Engulfing pattern, like its bullish counterpart, consists of two candlesticks. It starts with a smaller bullish candlestick, followed by a larger bearish candlestick that engulfs the previous one. This pattern signifies a reversal from a bullish to a bearish trend, indicating that sellers have regained control after a period of buyer dominance.
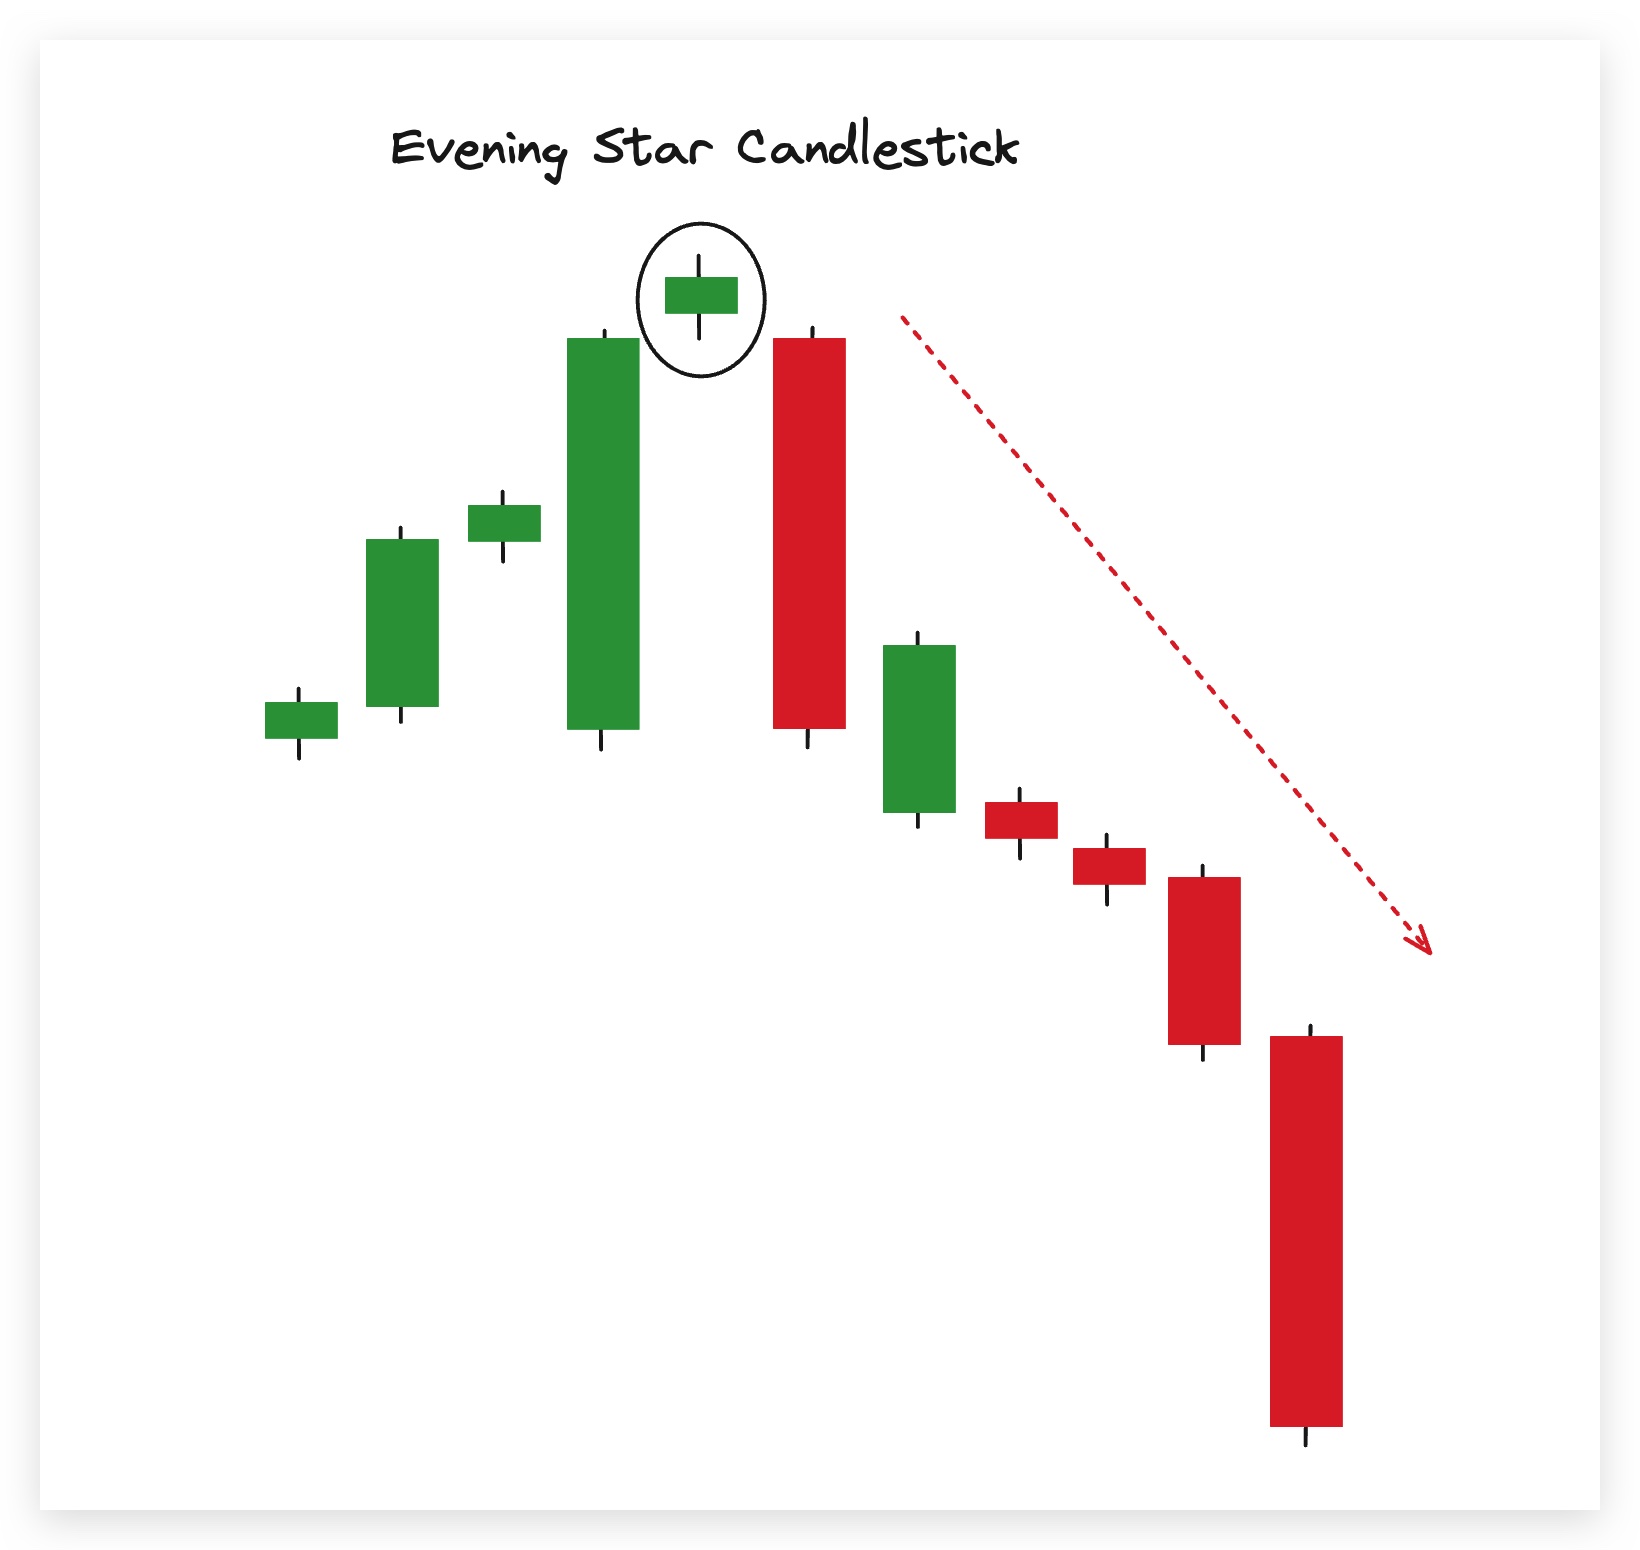
Evening Star:
The Evening Star pattern consists of three candlesticks, with a bullish candlestick followed by a small doji or spinning top, and finally a bearish candlestick that closes below the first candle’s midpoint. This pattern indicates a bearish reversal, symbolizing the shift from bullish enthusiasm to bearish skepticism.
Neutral Patterns:
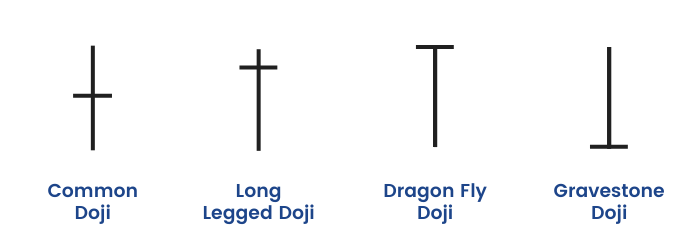
Doji:
The Doji is characterized by a small real body with long upper and lower shadows. It suggests market indecision and a potential reversal or continuation of the prevailing trend, depending on its context.
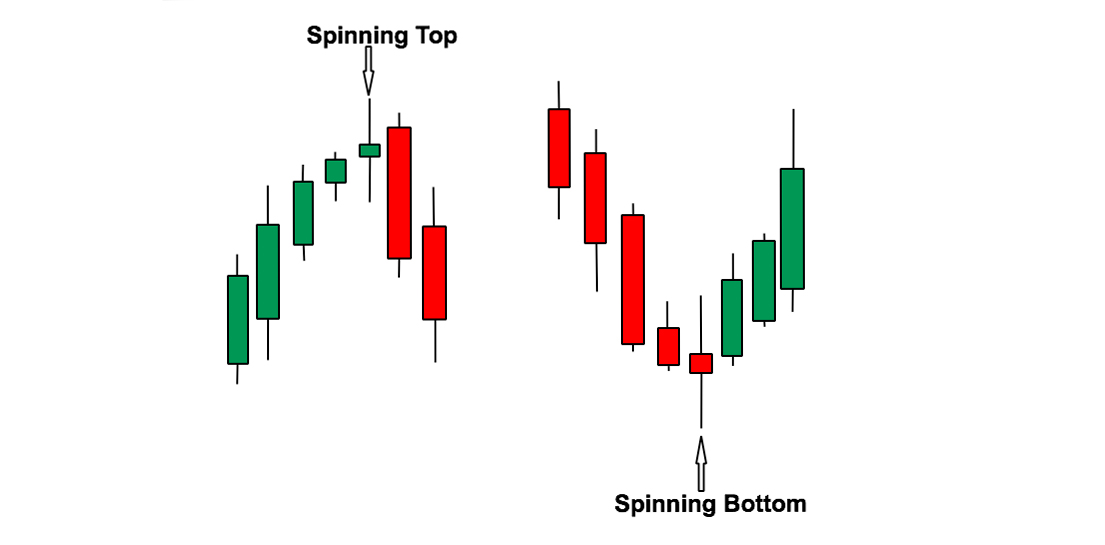
Spinning Top:
The Spinning Top exhibits a small real body with long upper and lower shadows, much like the Doji. It also represents market indecision, but unlike the Doji, it indicates less uncertainty and may signal a potential continuation of the existing trend.
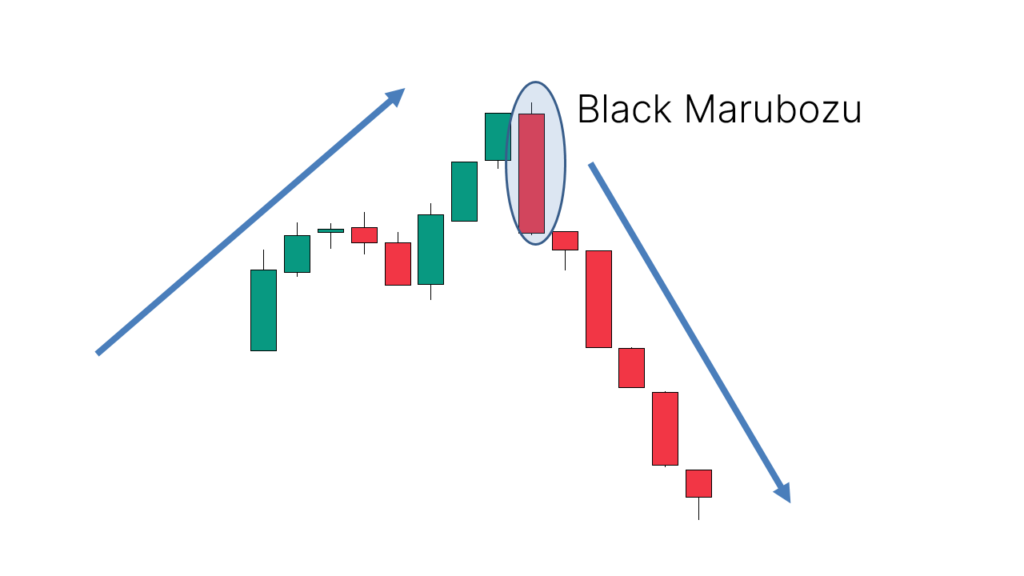
Marubozu:
The Marubozu is a candlestick with no shadows, featuring only a real body. It signals strong market sentiment, either bullish or bearish, depending on whether it is a white (bullish) or black (bearish) Marubozu.
Interpreting Candlestick Patterns
Let’s now see some real-world examples that illustrate the efficacy of candlestick patterns in guiding successful trades.
Using Multiple Timeframes
Candlestick patterns are most effective when analyzed across different timeframes. This approach, known as multi-timeframe analysis, allows traders to gain a more comprehensive understanding of market sentiment. By observing patterns on shorter timeframes (e.g., hourly or 15-minute charts) alongside longer timeframes (e.g., daily or weekly charts), traders can identify both short-term and long-term trends.
For example, a bullish engulfing pattern on a daily chart may indicate a potential uptrend, but it gains credibility when confirmed by similar patterns on shorter timeframes. This alignment of patterns across various timeframes reinforces the trader’s conviction.
Psychologically, multi-timeframe analysis can also reduce cognitive biases associated with short-term fluctuations. By considering longer-term trends, traders are less likely to succumb to impulsive decisions influenced by emotions.
Volume Analysis
Volume is a crucial component in confirming the validity of candlestick patterns. Volume represents the number of shares or contracts traded during a given time period and provides insight into the strength of market participants’ conviction.
When interpreting candlestick patterns, it is essential to corroborate them with substantial trading volume. High trading volume accompanying a bullish reversal pattern, such as a hammer or morning star, enhances the pattern’s credibility. Conversely, low volume during a reversal pattern may suggest a lack of market commitment.
Drawing from cognitive science, this integration of volume analysis into pattern recognition parallels the concept of “confirmation bias.” Traders must seek confirmation from objective data (i.e., volume) to avoid falling victim to their preconceived notions.
Role of Support and Resistance Levels
Support and resistance levels are critical reference points when interpreting candlestick patterns. Support levels are price levels at which an asset tends to find buying interest, preventing it from declining further. Conversely, resistance levels are price levels at which selling interest tends to emerge, halting further upward movement.
Candlestick patterns near support and resistance levels carry significant weight in technical analysis. For instance, a bullish reversal pattern forming at a major support level strengthens the likelihood of a price reversal, providing traders with a strategic entry point. This concept aligns with the psychology of “recency bias,” wherein recent price action (patterns near support/resistance) carries more psychological weight than historical data.
Real-World Examples:
-
Bullish Engulfing Pattern in Amazon (2020):
In March 2020, Amazon’s stock witnessed a bullish engulfing pattern on its daily chart near a significant support level. This pattern, accompanied by a surge in volume, marked the start of a substantial rally in Amazon’s share price.
-
Bearish Harami in Bitcoin (2017):
In December 2017, Bitcoin formed a bearish harami pattern on its weekly chart, near an all-time high resistance level. This pattern was followed by a significant price correction, validating the bearish signal it conveyed.
Extra: Candlesticks in Day Trading
Day trading is a distinct trading style that requires a unique set of skills and strategies. Unlike longer-term investing or swing trading, day trading involves opening and closing positions within the same trading day. Incorporating advanced candlestick trading strategies into day trading can be highly effective due to the rapid nature of this approach. Here, we explore how candlestick patterns and technical indicators can be tailored to suit the needs of day traders:
-Intraday Candlestick Patterns: Day traders often focus on shorter timeframes, such as minutes or hours. While traditional candlestick patterns remain relevant, intraday patterns like the one-minute chart patterns become essential for making rapid trading decisions.
-Scalping Strategies: Scalping is a popular day trading technique that involves making quick, small profits on numerous trades throughout the day. Candlestick patterns combined with indicators like the Relative Strength Index (RSI) can help day traders identify short-term overbought or oversold conditions.
-Volatility Considerations: Day traders thrive on volatility, but it also presents risks. Candlestick patterns can assist in gauging market sentiment during volatile sessions, helping traders enter and exit positions strategically.
-Time-of-Day Analysis: Different times of the trading day exhibit distinct price behaviors. Candlestick patterns and indicators can be employed to recognize optimal entry and exit points during specific trading hours.
-Real-time Decision Making: Day trading demands quick thinking and swift execution. Traders often rely on technical indicators and candlestick patterns as part of their real-time analysis to make rapid decisions.
Dissenting Opinions and Counter-arguments for Day Trading
-Efficient Market Hypothesis: Critics argue that day trading is inherently flawed as it relies on the assumption that short-term price movements can be consistently predicted. This perspective challenges the viability of day trading as a sustainable strategy.
-Psychological Challenges: Day trading can be mentally taxing, and cognitive biases may influence traders to make impulsive decisions. It is essential for day traders to manage emotions effectively, which is an ongoing challenge.
Incorporating day trading considerations into advanced candlestick trading strategies enhances the applicability of these techniques. By recognizing the shades of day trading, you can tackle the power of candlestick patterns and technical indicators to make informed decisions and navigate the complexities of the market with precision.
Pitfall and common mistakes
Overtrading based on candlestick patterns
Imagine you’re a sailor navigating through the Pacific Ocean. Would you steer your ship blindly, following the flickering lights of the shoreline? Of course not. You’d rely on your compass, your charts, and your knowledge of the tides. In the world of trading, candlestick patterns are but fleeting glimpses of light on the horizon. They can lead you astray if you make them your sole guide.
Do you want to be the sailor who crashes upon the rocks because they were mesmerized by the glow, or the one who reaches the distant shores through careful navigation?
Much like a mariner needs to study the stars and the currents, a trader must delve into the depths of fundamental analysis. Ignoring this crucial aspect is akin to setting sail without a map. You might drift for a while, but sooner or later, you’ll find yourself adrift, lost in the vast expanse of the market.
Ignoring fundamental analysis
Picture yourself building a house on shifting sands. No matter how exquisite the architecture, how intricate the design, it’s all in vain if your foundation is unstable. In the trading world, the fundamentals are your foundation. They are the bedrock upon which your decisions should rest.
Neglecting fundamentals is like trying to build a skyscraper on quicksand – a recipe for disaster.
Not considering market context
Attempting to trade without considering market context is like trying to solve a puzzle without seeing the whole picture – you’ll only get a fragment of the story.
Would you traverse a forest without a map or compass?
Lack of patience and discipline
Trading is no different from growing a plant in your backyard. Lack of patience and discipline is like expecting those seeds to bloom the very next day.
Do you believe that impulsive decisions and erratic behavior can lead to long-term success in any endeavor, let alone trading?
Just as a scientist meticulously follows the steps of an experiment, a trader must adhere to their strategy with unwavering discipline. Patience is the soil in which your profits will grow, and discipline is the water that sustains them.
We can firmly say that the trading world is filled with dangers, but armed with knowledge and guided by prudence, you can maneuver through the market. Just remember, candlestick patterns are not your North Star, fundamentals are your foundation, market context is your map, and patience and discipline are your allies.
What to avoid studying all these techniques and directly enjoy a trading journey set on autopilot?
Connect to our AI trading bot and try out the hands-free experience!
The AI bot will trade on your behalf. It will find the best time to buy and sell on its own. We have a crypto bot performance table that will show you the best performing crypto by the bot during the previous month.
DipSway uses a combination of 121+ technical indicators, and 17+ pattern detectors to give you an unfair advantage.
a single trade @ March 11 2024